Introduction: Why the U.S. Economy Feels “Good” and “Bad” at the Same Time
The K-shaped economy in 2026 is one of the biggest reasons many U.S. households feel confused about money right now. Some Americans are still spending on vacations, investing in stocks, using home equity, and feeling financially stable. At the same time, millions of households are struggling with higher grocery bills, expensive gasoline, credit card balances, rent pressure, and travel costs.
The U.S. economy in 2026 is sending mixed signals. Some Americans are still spending on vacations, investing in stocks, using home equity, and feeling financially stable. At the same time, millions of households are struggling with higher grocery bills, expensive gasoline, credit card balances, rent pressure, and travel costs.
This is why many people describe today’s economy as a K-shaped economy in 2026.
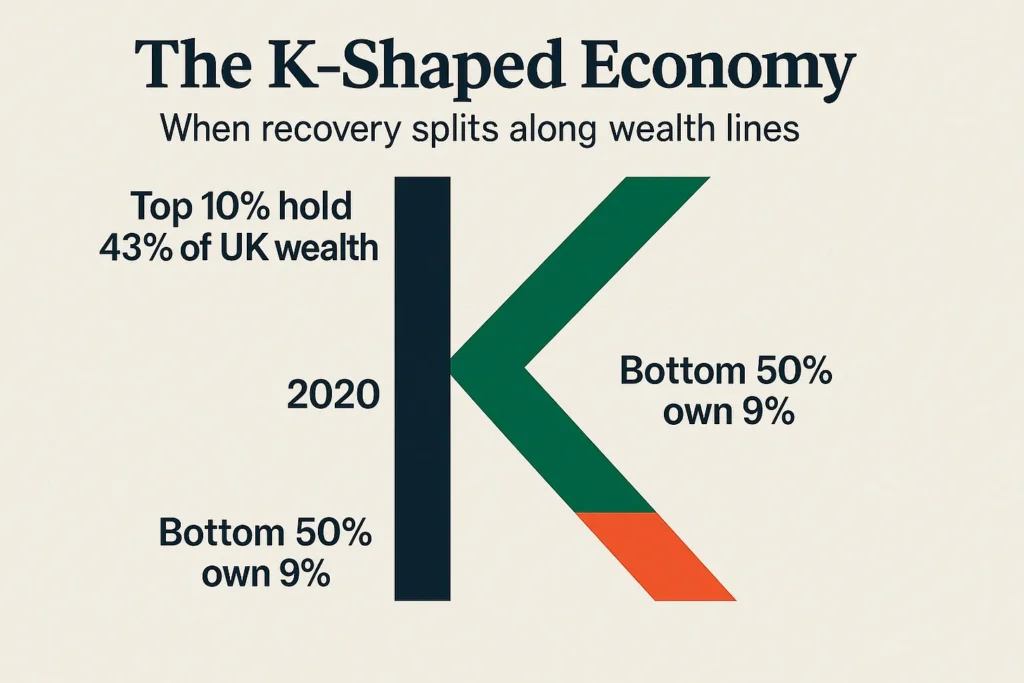
A K-shaped economy means different groups move in different directions. Higher-income households may continue to build wealth, while lower- and middle-income households feel squeezed by everyday costs.
  K-Shaped Economy in 2026

High-income households
↑ Stocks, home equity, travel spending, savings
 \
  \
   \________________ Economy average
   /
  /
 ↓ Lower/middle-income households
   Groceries, gas, rent, debt, credit card interest
The data explains why many U.S. households feel this pressure. In April 2026, the Consumer Price Index rose 3.8% year over year, food prices rose 3.2%, gasoline rose 28.4%, and airline fares jumped 20.7% from a year earlier.
What Is the K-Shaped Economy in 2026?
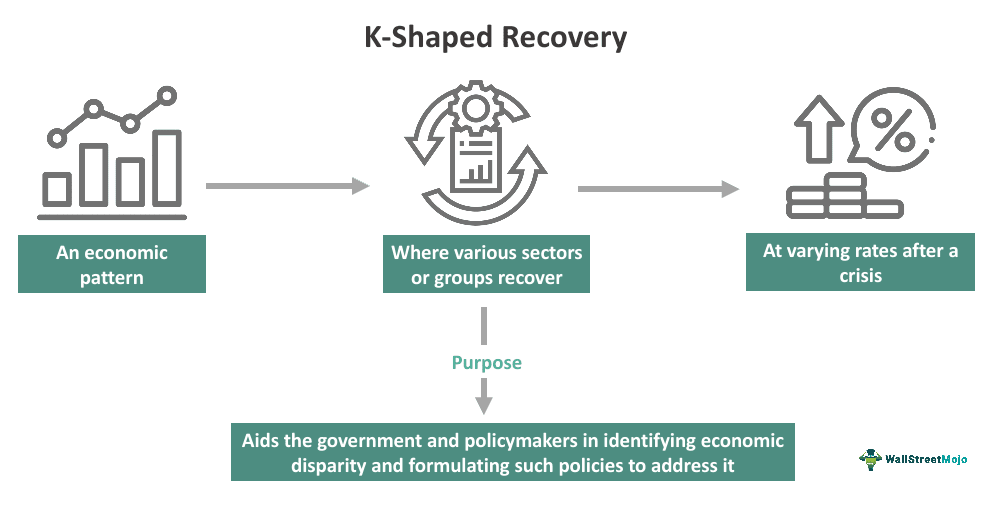
The K-shaped economy in 2026 describes an economy where people are not recovering or growing equally.
For example, a household with a strong salary, investments, home equity, and low debt may still feel confident. But a household living paycheck to paycheck may feel like inflation never ended.
The Federal Reserve’s 2025 household well-being report showed that 73% of U.S. adults said they were doing okay financially or living comfortably. But only 63% said they could cover a $400 emergency expense with cash or its equivalent. That means more than one-third of adults may still struggle with a small emergency.
That is the split: one side of the economy looks stable, while the other side feels fragile.
Inflation Is Still the Main Problem for Everyday Americans
Inflation has cooled from the extreme levels seen after the pandemic, but prices are still rising. The problem for households is simple: even when inflation slows, prices usually do not go back to where they were.
In April 2026, overall U.S. inflation was 3.8% over the previous 12 months. Core inflation, which excludes food and energy, rose 2.8%. Energy prices rose 17.9%, and food prices rose 3.2% over the same period.
For a family budget, this matters because food, gas, rent, insurance, and utilities are not optional. You can delay a new phone, but you cannot delay groceries.
Inflation Snapshot: April 2026
| Category | Year-over-Year Change |
|---|---|
| Overall CPI | +3.8% |
| Food | +3.2% |
| Food at home | +2.9% |
| Food away from home | +3.6% |
| Energy | +17.9% |
| Gasoline | +28.4% |
| Shelter | +3.3% |
| Airline fares | +20.7% |
Source: U.S. Bureau of Labor Statistics CPI data for April 2026.
Food Prices: Why Grocery Bills Still Feel Heavy
Food inflation is one of the biggest reasons the K-shaped economy in 2026 feels painful for U.S. households.
In April 2026, food at home rose 2.9% year over year, while food away from home rose 3.6%. Fruits and vegetables rose 6.1%, nonalcoholic beverages rose 5.1%, and cereals and bakery products increased 2.6% over the year.
That may not sound huge on paper, but grocery inflation hits repeatedly. A family buying milk, eggs, bread, fruit, meat, snacks, and drinks every week feels the increase again and again.
Monthly Food Pressure Example

Old grocery bill:       $700/month
If prices rise 3.2%:    +$22.40/month
New grocery bill:       $722.40/month

Annual extra cost:      $268.80/year
For a higher-income family, an extra $20–$50 per month may be annoying. For a lower-income household, it can mean using a credit card, skipping savings, or cutting back on healthier food.
Gas Prices and “Warflation”: A New Budget Shock
One major reason inflation feels worse in 2026 is the jump in energy prices. Some analysts call this warflation, meaning inflation caused or worsened by geopolitical conflict, war risk, or supply disruption.
Gasoline prices rose 28.4% year over year in April 2026, according to BLS. AAA reported the U.S. national average for regular gas at $4.533 per gallon on May 19, 2026, compared with $3.180 one year earlier.
That increase is huge for commuters, delivery drivers, small business owners, and families planning summer travel.
Drivers can also check the AAA national gas price tracker to see the latest average gas price in the U.S.
AAA currently shows regular gas at around $4.533 per gallon, compared with $3.180 one year ago.
Gas Cost Example

15-gallon tank at $3.18/gallon = $47.70
15-gallon tank at $4.53/gallon = $67.95

Extra per fill-up = about $20.25
If filling 4 times/month = about $81/month extra
This is why gas prices create a strong K-shaped effect. Remote workers or high-income households may absorb the cost. But hourly workers, gig drivers, and rural households often have fewer options.
Travel Costs Are Rising Faster Than Overall Inflation
Travel has become another clear example of the K-shaped economy in 2026.
The U.S. Travel Association reported that travel prices rose 7.8% year over year in April 2026, more than double the overall CPI increase of 3.8%. Airline fares rose 20.7%, hotel prices increased 4.3%, and motor fuel prices rose 29.1% year over year.
This creates two very different realities:
Some Americans are still booking vacations, flights, hotels, and experiences. Others are cutting trips, driving less, choosing staycations, or using credit cards to afford travel.
Travel Cost Pressure in 2026
| Travel Category | Year-over-Year Change |
|---|---|
| Travel Price Index | +7.8% |
| Airline fares | +20.7% |
| Hotel prices | +4.3% |
| Motor fuel | +29.1% |
Source: U.S. Travel Association, based on CPI travel-related categories.
Debt Is Making the Pressure Worse
Inflation hurts, but inflation plus debt hurts more.
According to the New York Fed, total U.S. household debt reached $18.8 trillion in Q1 2026. Mortgage balances were $13.19 trillion, auto loan balances were $1.69 trillion, student loan balances were $1.66 trillion, and credit card balances stood at $1.25 trillion.
This matters because many households are using debt as a shock absorber. When groceries, gas, rent, insurance, or travel get expensive, people may put more spending on credit cards.
U.S. Household Debt Snapshot: Q1 2026
| Debt Type | Balance |
|---|---|
| Total household debt | $18.8 trillion |
| Mortgages | $13.19 trillion |
| Auto loans | $1.69 trillion |
| Student loans | $1.66 trillion |
| Credit cards | $1.25 trillion |
Source: Federal Reserve Bank of New York Q1 2026 Household Debt and Credit Report.
The New York Fed also reported that 4.8% of outstanding debt was in some stage of delinquency in Q1 2026. Credit card early delinquency improved slightly from 8.7% to 8.6%, but that is still a warning sign that many borrowers are under stress.
Housing Costs Keep the Squeeze Alive
Housing is still one of the biggest reasons many Americans feel stuck.
BLS consumer expenditure data showed average annual U.S. household spending was $78,535 in 2024, while average income before taxes was $104,207. Housing spending increased 3.3% in 2024, with rented dwellings up 5.4% and owned dwellings up 7.0%.
The same data showed a huge spending gap between income groups. Average annual spending ranged from $35,046 for the lowest income quintile to $150,342 for the highest income quintile.
That gap explains the K-shape clearly. Higher-income households can spend, invest, and travel. Lower-income households are often forced to choose between rent, food, transportation, and debt payments.
Why Higher-Income Households Are Doing Better
The upper side of the K-shaped economy in 2026 is supported by assets.
The Federal Reserve reported that household and nonprofit net worth increased to $184.1 trillion in Q4 2025. Financial assets included $67.8 trillion in directly and indirectly held equity shares, while deposits and money market funds totaled $20.5 trillion.
The Fed also noted that changes in household wealth are often driven by corporate equity and real estate, and that equity ownership is concentrated among higher-income households.
In simple words: when stocks and assets rise, households that already own those assets benefit more.
Why Lower- and Middle-Income Households Feel More Pain
Lower- and middle-income families usually spend a bigger share of income on essentials. That means inflation in groceries, rent, gas, and utilities hits them harder.
For example:
Household A: earns $150,000/year
Extra inflation cost: $300/month
Impact: painful but manageable

Household B: earns $45,000/year
Extra inflation cost: $300/month
Impact: major budget stress
This is the heart of the K-shaped economy in 2026. The same price increase does not hurt every family equally.
How U.S. Households Can Protect Their Money in 2026
The goal is not to panic. The goal is to adjust.
Here are practical steps Americans can take:
1. Build a Small Emergency Fund First
Start with $500 to $1,000 before chasing big financial goals. Since only 63% of adults can cover a $400 emergency with cash or its equivalent, even a small emergency fund can reduce credit card dependence.
2. Track Food Spending Weekly
Instead of only checking monthly spending, track grocery spending every week. Food prices are rising enough that small leaks matter.
Try this simple rule:
Weekly grocery budget: $175
Monthly target: $700
If week 1 spending is $210,
reduce week 2 by $35 or adjust meals.
3. Reduce Gas Waste
With gas around $4.533 per gallon nationally on May 19, 2026, small driving changes can save real money. Combine errands, avoid unnecessary trips, use fuel rewards, and compare local stations.
4. Avoid Carrying Credit Card Balances
Credit card balances across the U.S. stood at $1.25 trillion in Q1 2026. If possible, avoid using credit cards for groceries and gas unless you can pay the balance in full.
5. Travel Smarter, Not Later
Travel prices rose 7.8% year over year in April 2026, so flexible planning matters. Use off-peak dates, compare airports, book early when possible, and avoid financing vacations with high-interest debt.
Final Thoughts: The Economy Is Growing, But Not Equally
The K-shaped economy in 2026 is not just an economic phrase. It is what many Americans feel every month when they pay for groceries, gas, rent, insurance, credit cards, and travel.
The data shows the split clearly. Inflation is still above the Federal Reserve’s long-term 2% goal, gasoline prices are much higher than a year ago, travel costs are rising faster than overall inflation, and household debt remains near record levels. At the same time, asset-owning households continue to benefit from stocks, home equity, and savings.
For readers, the best strategy is simple: protect cash flow, reduce high-interest debt, build emergency savings, and make spending decisions based on real numbers—not social media pressure.
In 2026, financial survival is not about looking rich. It is about staying flexible, avoiding unnecessary debt, and making every dollar work harder.
Related money guides: Want more simple explanations about inflation, debt, household budgets, and U.S. money trends? Visit our FinanceWithDevel homepage for more beginner-friendly finance guides.

“Hi, I am Devel Gupta, an entrepreneur and the founder of FinanceWithDevel. With 10 years of experience in teaching and simplifying personal finance, my mission is to help beginners build long-term wealth without the confusing jargon. Whether it’s budgeting, investing, or retirement planning, I believe financial freedom starts with simple, consistent habits. Let’s make money make sense. Connect with me on [ LinkedIn/Twitter ] for more daily tips!”