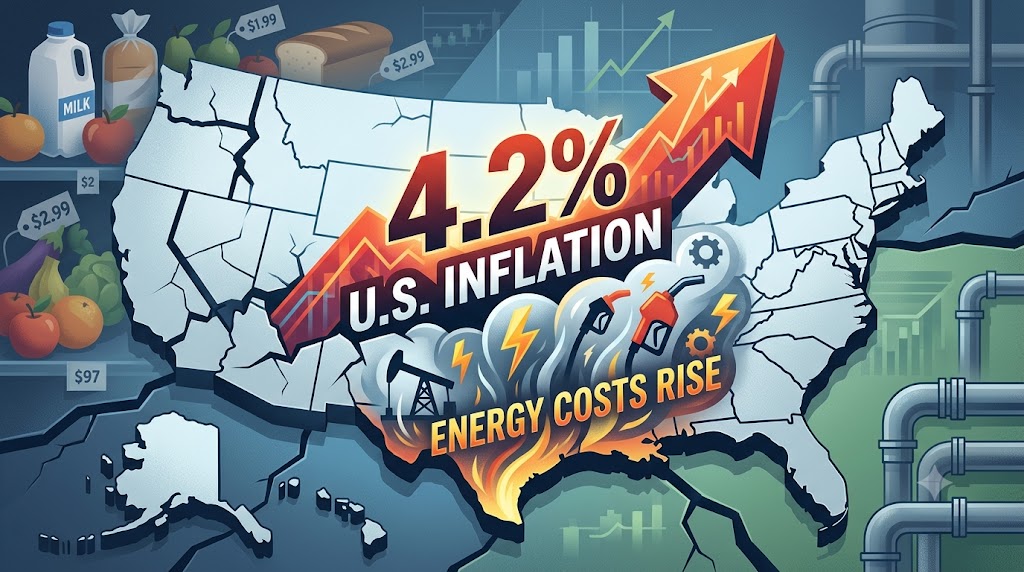
U.S. Inflation Climbs to 4.2% as Energy Costs Rise
Inflation is the rate at which prices rise, and your money slowly loses buying power. When the same $100 buys less gas, fewer groceries, or a smaller restaurant meal than it did last year, inflation is doing its quiet work. The latest government data confirms that U.S. Inflation Climbs to 4.2% as Energy Costs Rise, and the biggest pressure is coming from energy. That matters because energy is not just a gas-station problem; it moves through shipping, utilities, airline fares, grocery costs, and business expenses.
U.S. Inflation Climbs to 4.2% as Energy Costs Rise
U.S. Inflation Climbs to 4.2% as Energy Costs Rise, according to the latest CPI report from the U.S. Bureau of Labour Statistics. The CPI rose 0.5% in May and 4.2% over the past 12 months, while core CPI, which excludes food and energy, rose 2.9% from a year earlier. Energy prices rose 23.5% over the year, and gasoline jumped 40.5%, making fuel one of the clearest reasons households are feeling squeezed. The Federal Reserve still targets 2% inflation over the longer run, so a 4.2% reading keeps pressure on interest-rate policy and household budgets.
Current Inflation Readings
| Inflation Index (Report) | Current Monthly Rise | Annual Rate (12-Month) | Key Driver / Note |
| CPI (May) | 0.5% | 4.2% | Driven by 40.5% jump in Gasoline |
| Core CPI (May) | 0.2% | 2.9% | Excludes volatile food & energy |
| PCE (April) | — | 3.8% | Fed’s closely watched indicator |
| Core PCE (April) | — | 3.3% | Target is 2.0% over longer run |
| PPI (April) | 1.4% | 6.0% | Wholesale prices (Sellers’ side) |
Before getting into the details, the main point is simple: U.S. Inflation Climbs to 4.2% as Energy Costs Rise, and the pressure is most visible in fuel and household energy bills.
CPI for May
The consumer price index, or CPI, is the inflation number most people hear about first. It measures the average change in prices paid by urban consumers for common goods and services, including food, housing, gasoline, electricity, clothing, medical care, and transportation. In May, the CPI increased 0.5% from the previous month after a 0.6% rise in April. Over the past year, U.S. inflation climbed to 4.2% as energy costs rose, up from 3.8% in April. Core CPI rose 0.2% for the month and 2.9% over the year, which shows that inflation is not only about gasoline, even though energy is the loudest part of the story right now.
Energy prices rose 3.9% in May alone, with gasoline up 7% for the month. Over 12 months, energy climbed 23.5%, and gasoline rose 40.5%. That is a huge move for families who commute daily, drive kids to school, or rely on a car because public transit is limited. Food prices rose more slowly than energy, but grocery shoppers may still feel pressure because food at home, restaurant meals, and household staples add up every week.
PCE for April
The personal consumption expenditures price index, or PCE, is another major inflation measure. While CPI focuses on what consumers pay for a fixed basket of goods and services, PCE also captures how consumers change behaviour when prices move. For example, if gas prices rise and people drive less or switch spending to other categories, PCE reflects those shifts more directly. The BEA reported that PCE prices rose 3.8% over the year in April, while core PCE rose 3.3%. That matters because the Federal Reserve pays close attention to core PCE when thinking about interest rates.
When U.S. Inflation Climbs to 4.2% as Energy Costs Rise, the Fed does not look at CPI alone. Policymakers compare CPI, PCE, wage growth, employment, financial conditions, and inflation expectations. If inflation looks persistent, borrowing costs can stay higher for longer. That affects credit cards, auto loans, mortgages, personal loans, and even business financing. So even if a household is not watching Fed meetings, Fed decisions can still show up in monthly payments.
PPI for April
The producer price index, or PPI, tracks prices from the seller’s side of the economy. In simple terms, it looks at what producers and manufacturers receive for goods and services before many of those costs reach consumers. The latest PPI report showed final demand prices rose 1.4% in April and 6.0% over 12 months. That is important because rising producer costs can later become higher shelf prices, higher service prices, or smaller business margins.
If a company pays more for fuel, packaging, shipping, electricity, or raw materials, it has a choice: absorb the cost, raise prices, reduce discounts, or cut elsewhere. None of those choices feel great. This is why U.S. Inflation Climbs to 4.2% as Energy Costs Rise is more than a headline. It can be the start of a cost chain that moves from oil markets to factories, from factories to retailers, and from retailers to your cart.
How Inflation Is Measured
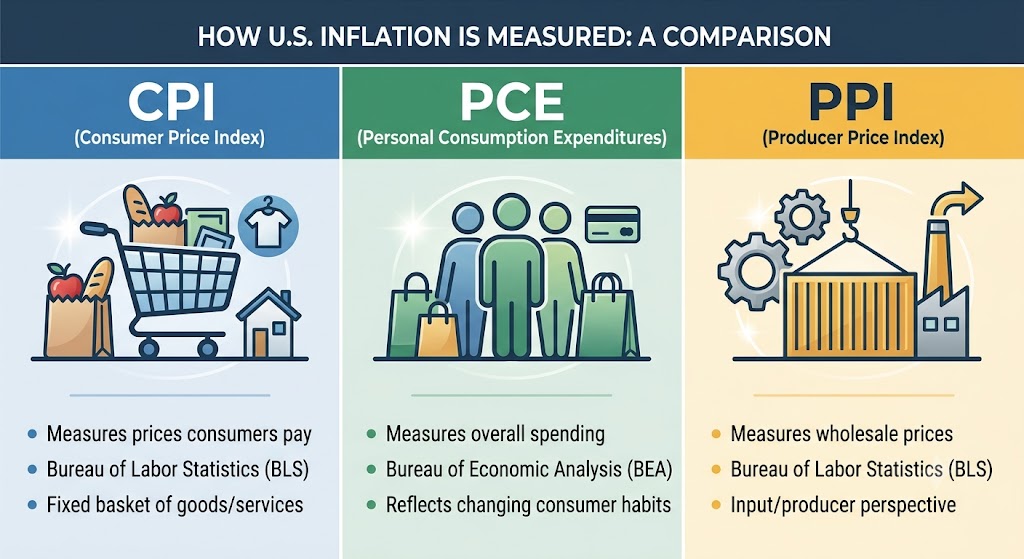
There are three big reports people usually watch: CPI, PCE, and PPI. CPI comes from the U.S. Bureau of Labour Statistics and is the most common consumer inflation measure. PCE comes from the Bureau of Economic Analysis and is the Fed’s preferred inflation gauge. PPI also comes from the BLS and helps show price pressure at the wholesale and producer level.
The difference matters because each report tells a slightly different story. CPI is useful because it feels close to everyday life. PCE is useful because it shows broader consumer spending behaviour. PPI is useful because it can signal what may happen to future consumer prices. When U.S. Inflation Climbs to 4.2% as Energy Costs Rise, all three reports help readers understand whether the pressure is temporary, narrow, or spreading across the economy.
» MORE: Run the numbers with the U.S. Bureau of Labour Statistics inflation calculator.
| Index Name | Full Form | Who Releases It? | What Does It Track? |
| CPI | Consumer Price Index | Bureau of Labor Statistics (BLS) | What consumers pay for a fixed basket |
| PCE | Personal Consumption Expenditures | Bureau of Economic Analysis (BEA) | Changes in actual consumer behavior |
| PPI | Producer Price Index | Bureau of Labor Statistics (BLS) | Prices received by sellers/wholesalers |
What is the CPI?
The consumer price index, or CPI, measures the change in average prices paid by consumers for a set of goods and services that represent regular expenses, like groceries or gas.
The CPI is calculated by the U.S. Bureau of Labor Statistics and is used as a proxy for inflation. Every month, the BLS releases updated CPI data, showing monthly and annual changes in average prices.
May CPI report
The CPI increased 0.5% over the one-month period from April to May, after increasing 0.6% from March to April. Over the past 12 months, the index increased 4.2%, up from a 3.8% annual rate in April.
Core CPI — a measure that excludes food and energy prices because of their volatility — rose 0.2% from April to May, and 2.9% over the past 12 months, up from 2.8% in April.
Energy prices rose 3.9% in May, after rising 3.8% in April (and 10.9% in March), driven by volatile fuel prices. Over the last 12 months, the index for energy is up 23.5%, compared with a 17.9% annual increase in April. Gasoline prices rose 7% in May and are up a staggering 40.5% over the last 12 months.
Food prices rose 0.2% in May, after a 0.5% rise in April. Food overall is up 3.1% over the last year. Food at home rose 0.1% in May, while food away from home rose 0.3%.
Shelter, which includes rent, increased at a rate of 0.3% in May, compared to 0.6% in April. See below for a look at the CPI’s key indexes.
The latest CPI report shows prices increased in April for household furnishings and operations, airline fares, personal care, apparel, and education. Prices went down in other areas. New vehicles, communication and medical care indexes all fell.
When is the next CPI report released?
The next CPI report will be released on July 14 and show data for June 2026
What is the PCE?
The personal consumption expenditures price index, or PCE, measures changes in consumer spending on typical goods and services. It’s used to calculate inflation (or deflation) in the U.S. economy.
Updated each month by the Bureau of Economic Analysis (BEA), the PCE tracks what kinds of goods and services consumers buy and how much they pay for them, as well as how consumers change their spending habits when prices rise or fall.
For example, if rising gas prices lead consumers to drive less and cut down on fuel spending, the PCE will reflect that change in purchase frequency.
What’s the core PCE and why does it matter so much?
Core PCE is the Federal Reserve’s preferred measure of inflation. Core PCE excludes food and fuel — two categories that frequently experience price swings. Increases in both PCE and core PCE can signal an increase in inflation; decreases may signal a decline in inflation. These results could also indicate that inflation is still growing, but at a cooler pace.
The Fed’s target for inflation is 2% on an annual basis.
- PCE is at 3.8% over the past year, up from 3.5% in March.
- Core PCE rose 3.3% over the past year, up from 3.2% in March.
When is the next PCE report released?
The PCE is released monthly in the BEA’s Personal Income and Outlays report. The next release, covering May, is scheduled for June 25.
What is the PPI?
The PPI tracks the prices that producers and manufacturers receive for their goods from retailers and distributors. The PPI rises when producers and manufacturers charge higher prices for their products, likely to offset the rising costs of raw materials or distribution.
In this way, PPI functions as another measure of inflation, similar to the consumer price index and personal consumption expenditures price index, which track the prices consumers pay for goods and services. But unlike those two indexes, the PPI shows how prices are changing for retailers who are buying at the wholesale level.
“In general, the PPI is about the price change from the perspective of the seller,” says Thomas McDonald, a senior economist at the BLS. That makes the PPI a leading indicator of inflation since higher prices on the producers’ end often lead to increased prices for consumers.
April PPI report
The index rose 1.4% in April. Compared to a year ago, the index increased 6%.
Here are highlights from the latest PPI report:
- Core PPI, which excludes food, energy and trade services, increased by 0.6% in April — the highest growth since October 2025. It rose 4.4% compared to a year ago — the highest 12-month increase since February 2023 (+4.5%).
- Final demand goods prices rose 2% in April, compared to 1.9% in March. Much of that can be attributed to a 7.8% monthly rise in the prices for final demand energy.
- Final demand services prices rose 1.2% in April — the largest increase since March 2022 (+1.3%).
When is the next PPI report released? The BLS releases a monthly PPI report showing how the index changed. The PPI report for May will be released on June 11.
What Is Driving Inflation Higher?
At a practical level, U.S. Inflation Climbs to 4.2% as Energy Costs Rise because energy costs feed into both direct household bills and business operating costs.
Energy Prices
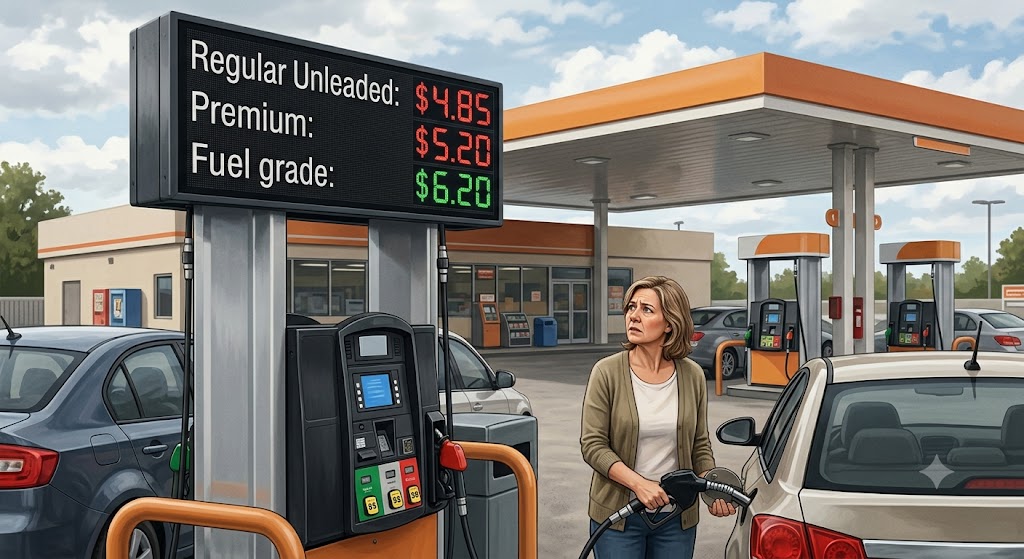
Energy is the biggest reason this report feels so painful. Gasoline is visible, immediate, and difficult for many households to avoid. If your weekly gas bill rises from $45 to $65, that extra $20 has to come from somewhere: groceries, savings, debt payments, or fun spending. When U.S. Inflation Climbs to 4.2% as Energy Costs Rise, families with long commutes, older cars, or multiple drivers often feel the pressure first.
Energy also affects businesses. Trucking companies need diesel, airlines need jet fuel, stores need electricity, and food suppliers need refrigeration. Higher energy prices can push up costs long before the consumer sees the final price tag. That is why energy shocks can feel like a wave: first gas, then transportation, then services, then everyday goods.
Food and Grocery Costs
Food inflation is not rising as sharply as energy, but it still matters because food is not optional. A family can skip a vacation, but it cannot skip dinner. Higher transportation and energy costs can make food production and delivery more expensive. Grocery stores may also face higher labour, refrigeration, rent, and packaging costs.
When U.S. Inflation Climbs to 4.2% as Energy Costs Rise, shoppers should focus on habits that reduce waste without making life miserable. Meal planning, store-brand swaps, freezer use, bulk buying for items you actually use, and comparing unit prices can all help. The goal is not to live like a spreadsheet. The goal is to keep your grocery bill from quietly hijacking your budget.
Housing and Rent
Shelter is one of the largest parts of CPI. Rent, owners’ equivalent rent, utilities, insurance, maintenance, and property taxes can all affect housing costs. Even if energy is the headline driver, housing can keep inflation sticky because leases and homeownership costs do not reset overnight. A renter facing a lease renewal may not care that core inflation is lower than headline inflation; they care about the new monthly payment.
If U.S. Inflation Climbs to 4.2% as Energy Costs Rise, renters may want to start renewal conversations early, compare nearby neighborhoods, and calculate moving costs before making a decision. Homeowners should review insurance, utility usage, and maintenance plans. Small changes may not erase inflation, but they can reduce the monthly squeeze.
Transportation Costs
Transportation includes more than gasoline. Auto insurance, car repairs, tires, public transit, rideshares, airline fares, and delivery fees can all affect household spending. If energy prices rise, transportation-heavy categories often react quickly. This can hit workers who cannot work from home especially hard.
That is why U.S. Inflation Climbs to 4.2% as Energy Costs Rise can feel different depending on where you live. A city renter who walks to work may feel grocery and rent pressure more than gas prices. A suburban family with two cars may feel gas, insurance, repairs, and grocery delivery costs at the same time. Your personal inflation rate depends on your lifestyle.
Why Inflation Matters
Inflation matters because it changes the math of everyday life. If wages do not keep up with prices, households lose ground even when income looks stable on paper. A $4,000 monthly income feels very different when rent, gas, food, insurance, and debt payments all rise together. This is especially tough for families already operating on thin margins.
U.S. Inflation Climbs to 4.2% as Energy Costs Rise also matters for interest rates. If inflation stays above the Fed’s 2% target, rate cuts may become less likely, and borrowing may stay expensive. Credit card balances can become more painful, mortgage affordability can weaken, and auto loans can stretch budgets. For savers, higher rates can help high-yield savings accounts, but cash earning less than inflation still loses purchasing power over time.
What Gets More Expensive and What You Can Do
| What Gets More Expensive | How Consumers Can Respond |
| Gas and commuting | Combine errands, compare fuel prices, use rewards carefully, and check transit options |
| Groceries | Meal plan, buy store brands, compare unit prices, and reduce food waste |
| Electricity and utilities | Adjust thermostat settings, seal leaks, and review energy usage |
| Credit card debt | Pay more than the minimum and focus on high-interest balances first |
| Rent and housing | Start renewal talks early and compare total moving costs |
| Savings goals | Use high-yield savings for short-term cash and invest long-term money wisely |
How to Protect Against Inflation

Avoid Holding Too Much Idle Cash
Cash is useful for emergencies, upcoming bills, and peace of mind. But too much idle cash can lose value when prices rise. If U.S. Inflation Climbs to 4.2% as Energy Costs Rise, money sitting in a low-interest checking account may not keep up with the cost of living. Short-term savings can go in a high-yield savings account or money market account, while money not needed for several years may be better suited for a diversified investment plan.
Diversify Your Portfolio
Diversification means not putting all your money in one basket. Stocks, bonds, cash, real estate, and inflation-protected securities may behave differently during inflationary periods. Treasury Inflation-Protected Securities, or TIPS, are designed to adjust with CPI, while I bonds can also offer inflation-linked returns. Stocks can help over the long run, especially companies with pricing power, but they can also be volatile in the short term.
Review Debt Before It Gets Heavier
Debt can become more stressful when inflation and high interest rates meet. Credit cards are the biggest danger because variable APRs can make balances grow quickly. If U.S. Inflation Climbs to 4.2% as Energy Costs Rise, review your balances, due dates, APRs, and minimum payments. A balance transfer, debt payoff plan, or personal loan may help some borrowers, but fees and terms matter.
Conclusion
U.S. Inflation Climbs to 4.2% as Energy Costs Rise is not just an economic headline. It is a warning sign for household budgets, especially when gasoline, utilities, groceries, transportation, and borrowing costs are all in play. To understand how these current numbers stack up against previous trends, you can read our detailed analysis in the Current U.S. Inflation Rate Is 3.8%: Chart and Why It Matters report.
The smartest response is practical, not panicked. Update your budget with real prices, protect your emergency fund, reduce high-interest debt, compare recurring bills, and keep long-term investing decisions steady. Inflation can make money feel slippery, but a clear plan gives you a better grip.
Financial Disclaimer
This article is for educational purposes only and should not be considered personal financial advice. Consider speaking with a qualified financial advisor, tax professional, or credit counselor before making major decisions about investing, borrowing, retirement planning, or debt repayment.
FAQs
Is the 4.2% inflation rate confirmed?
Yes. The latest CPI data confirms that U.S. Inflation Climbs to 4.2% as Energy Costs Rise, with the CPI up 4.2% over the 12 months ending in May.
Why are energy costs so important for inflation?
Energy affects gasoline, electricity, shipping, food production, air travel, and business operations. That means higher energy prices can spread across many parts of the economy.
Does core inflation include gas and groceries?
No. Core CPI excludes food and energy because those categories are often volatile. However, households still pay for food and energy, so headline inflation matters in real life.
Will the Federal Reserve cut interest rates soon?
A higher inflation reading can make rate cuts less likely. The Fed looks at several indicators, including CPI, PCE, jobs data, and inflation expectations before changing rates.
What should consumers do first?
Start with your budget. Because U.S. Inflation Climbs to 4.2% as Energy Costs Rise, update gas, grocery, utility, and debt-payment categories using your real recent spending, then look for savings that do not damage your long-term financial goals.
“Hi, I am Devel Gupta, an entrepreneur and the founder of FinanceWithDevel. With 10 years of experience in teaching and simplifying personal finance, my mission is to help beginners build long-term wealth without the confusing jargon. Whether it’s budgeting, investing, or retirement planning, I believe financial freedom starts with simple, consistent habits. Let’s make money make sense. Connect with me on [ LinkedIn/Twitter ] for more daily tips!”